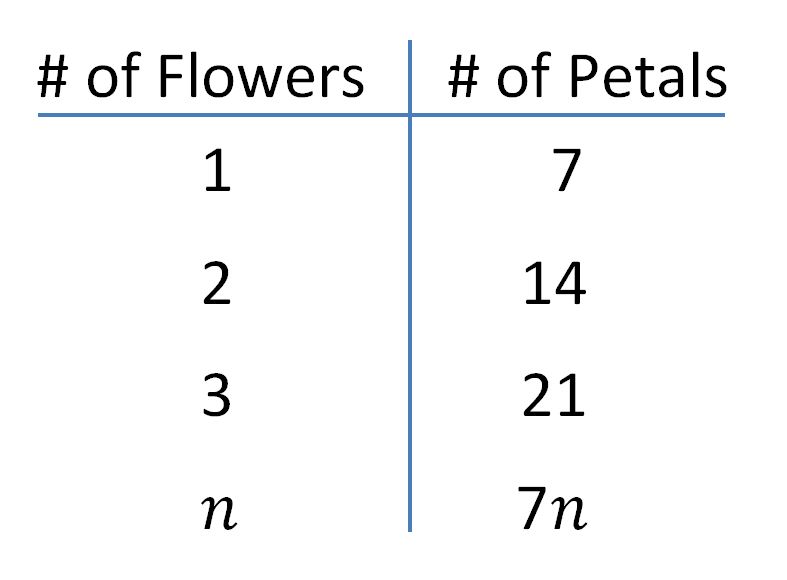
8.F.A.3 ...give examples of functions that are not linear.
For example, the function A = s2 giving the area of a square as a function of its side length is not linear because its graph contains the points (1,1), (2,4) and (3,9), which are not on a straight line. 

Daisy and Whilson measure the height of the water in millimeters each time they add a small cupful of water. They record the Number of Cups (input) and Height of the Water in mm (output).
I used various bottle shapes, so the graphs were all different and interesting to compare with the shape of the glass containers.

Using a F.O.S.S. kit activity, Cristian, Abraham, and Jasmine measure the strength of the magnet(s) on one side of the balance scale by counting the number of weights they are able to add to the other side each time before the balance tips.

The students record and graph their various attempts each time as they increase the number of magnets on the right and perfect how they place the weights inside the cup on the left. Our record weight placement was 23 metal washers before the balance tipped, because the magnets were not strong enough to hold more. Great fun!

Square Numbers
I told my 4th grade students to select one block color and find a sequence that would grow in a pattern of similar shapes. They soon discovered that the pattern was increasing by square numbers.

Stage 4 = 16 blocks

It doesn't matter what color pattern block the students choose, they will all grow in the same square number pattern.
Cristal doesn't see the squares yet, but later realizes her mistake and is able to construct the same number pattern.

Cesar was able to build the first two stages of the red trapezoid pattern, but struggled with what the third stage should look like. I showed him how to measure the ratio of the top and bottom lengths of the trapezoid with green triangles. He saw a ratio of 1:2, then 2:4, then 3:6, etc., and could then tell when the shapes were similar.


After letting Cesar struggle for awhile, I showed him how the red pattern block grows like the rings on a tree. Just like the orange blocks that form squares, it has a sequence of adding odd integers...1 + 3 + 5 + 7, and so on as you continue to build similar shapes.
Jason studies his sequence with the tan rhombuses. He sees a pattern of 1 length on a side, then 2 lengths on a side, then 3 lengths on a side, and so on.


Stage 1 = 1 block
Stage 2 = 4 blocks
Stage 3 = 9 blocksStage 4 = 16 blocks

It doesn't matter what color pattern block the students choose, they will all grow in the same square number pattern.
Cristal doesn't see the squares yet, but later realizes her mistake and is able to construct the same number pattern.

Cesar was able to build the first two stages of the red trapezoid pattern, but struggled with what the third stage should look like. I showed him how to measure the ratio of the top and bottom lengths of the trapezoid with green triangles. He saw a ratio of 1:2, then 2:4, then 3:6, etc., and could then tell when the shapes were similar.


After letting Cesar struggle for awhile, I showed him how the red pattern block grows like the rings on a tree. Just like the orange blocks that form squares, it has a sequence of adding odd integers...1 + 3 + 5 + 7, and so on as you continue to build similar shapes.
Jason studies his sequence with the tan rhombuses. He sees a pattern of 1 length on a side, then 2 lengths on a side, then 3 lengths on a side, and so on.

The only pattern block that needs another color to help it grow correctly is the yellow hexagon. Patricio wanted a challenge, so he and Eligio decided to tackle this one.
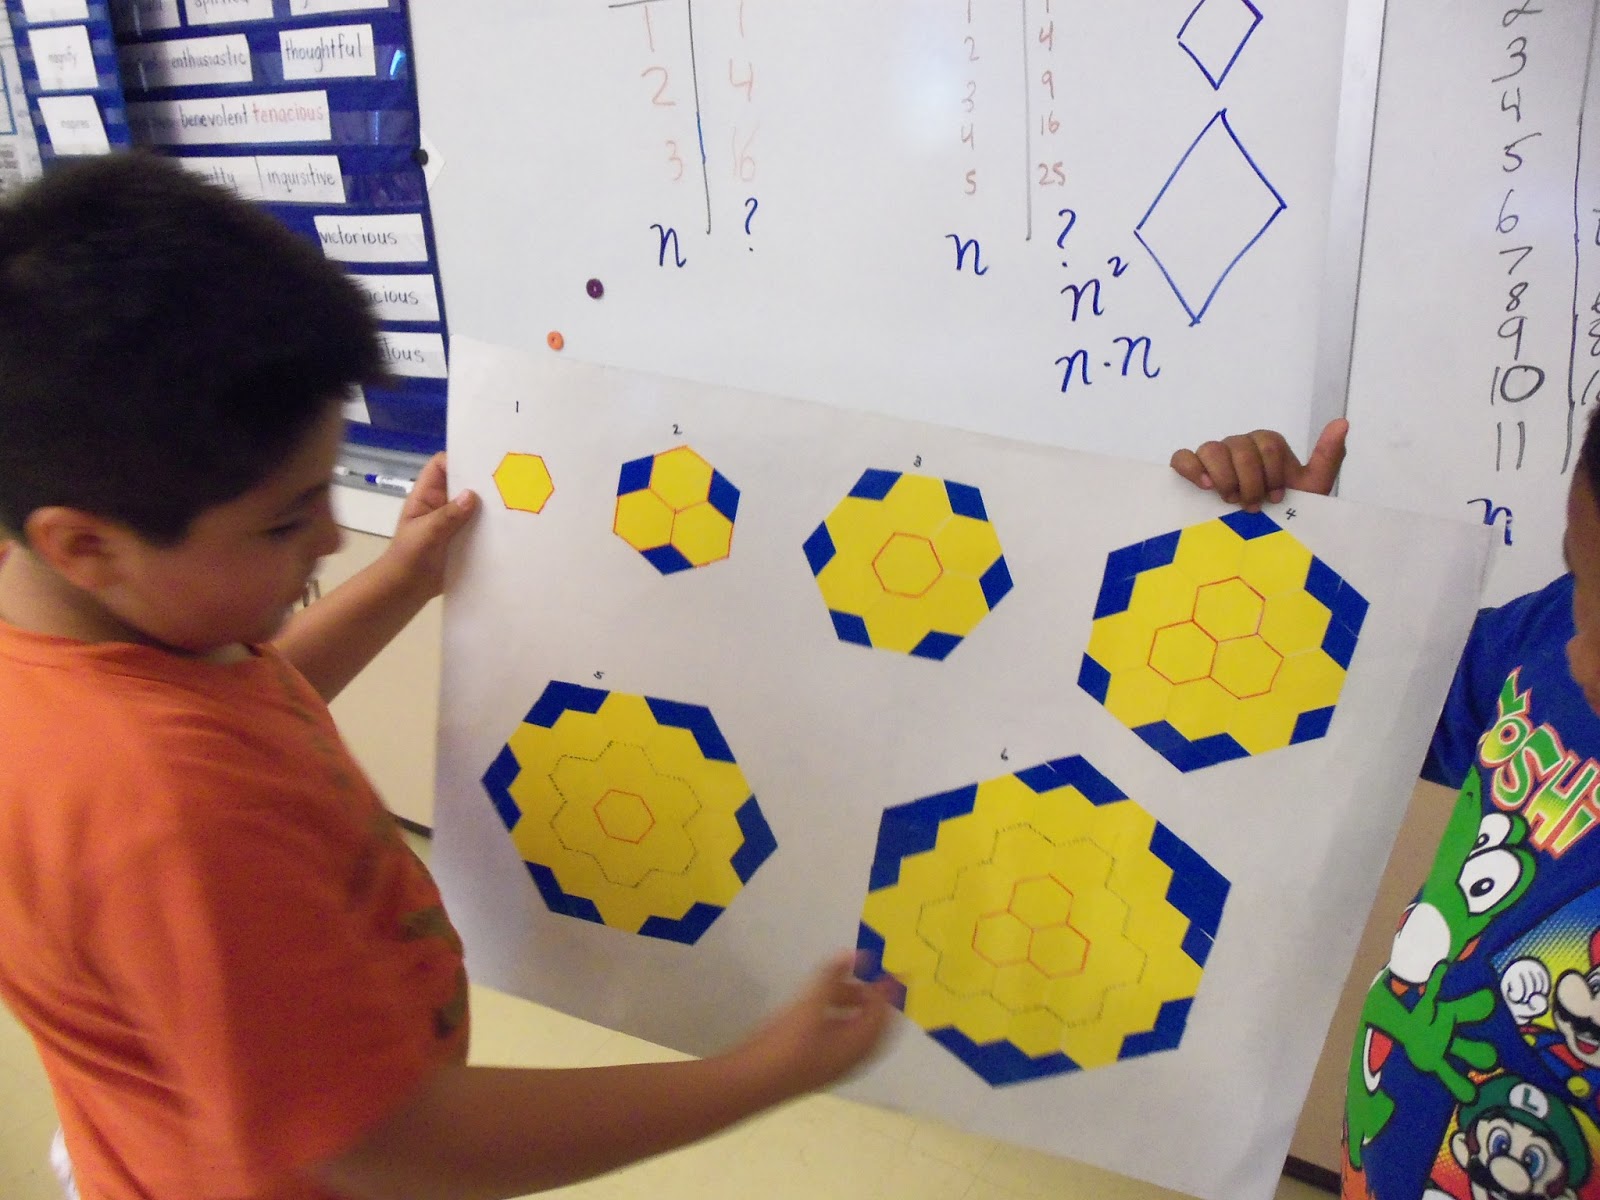
The yellow blocks follow the same square number pattern as the other blocks if you look at the area of three blue blocks as equaling one yellow block. In this way, the second stage has 3 yellow blocks plus another yellow block (after you trade the 3 blue blocks) for a total of 4 yellow blocks.

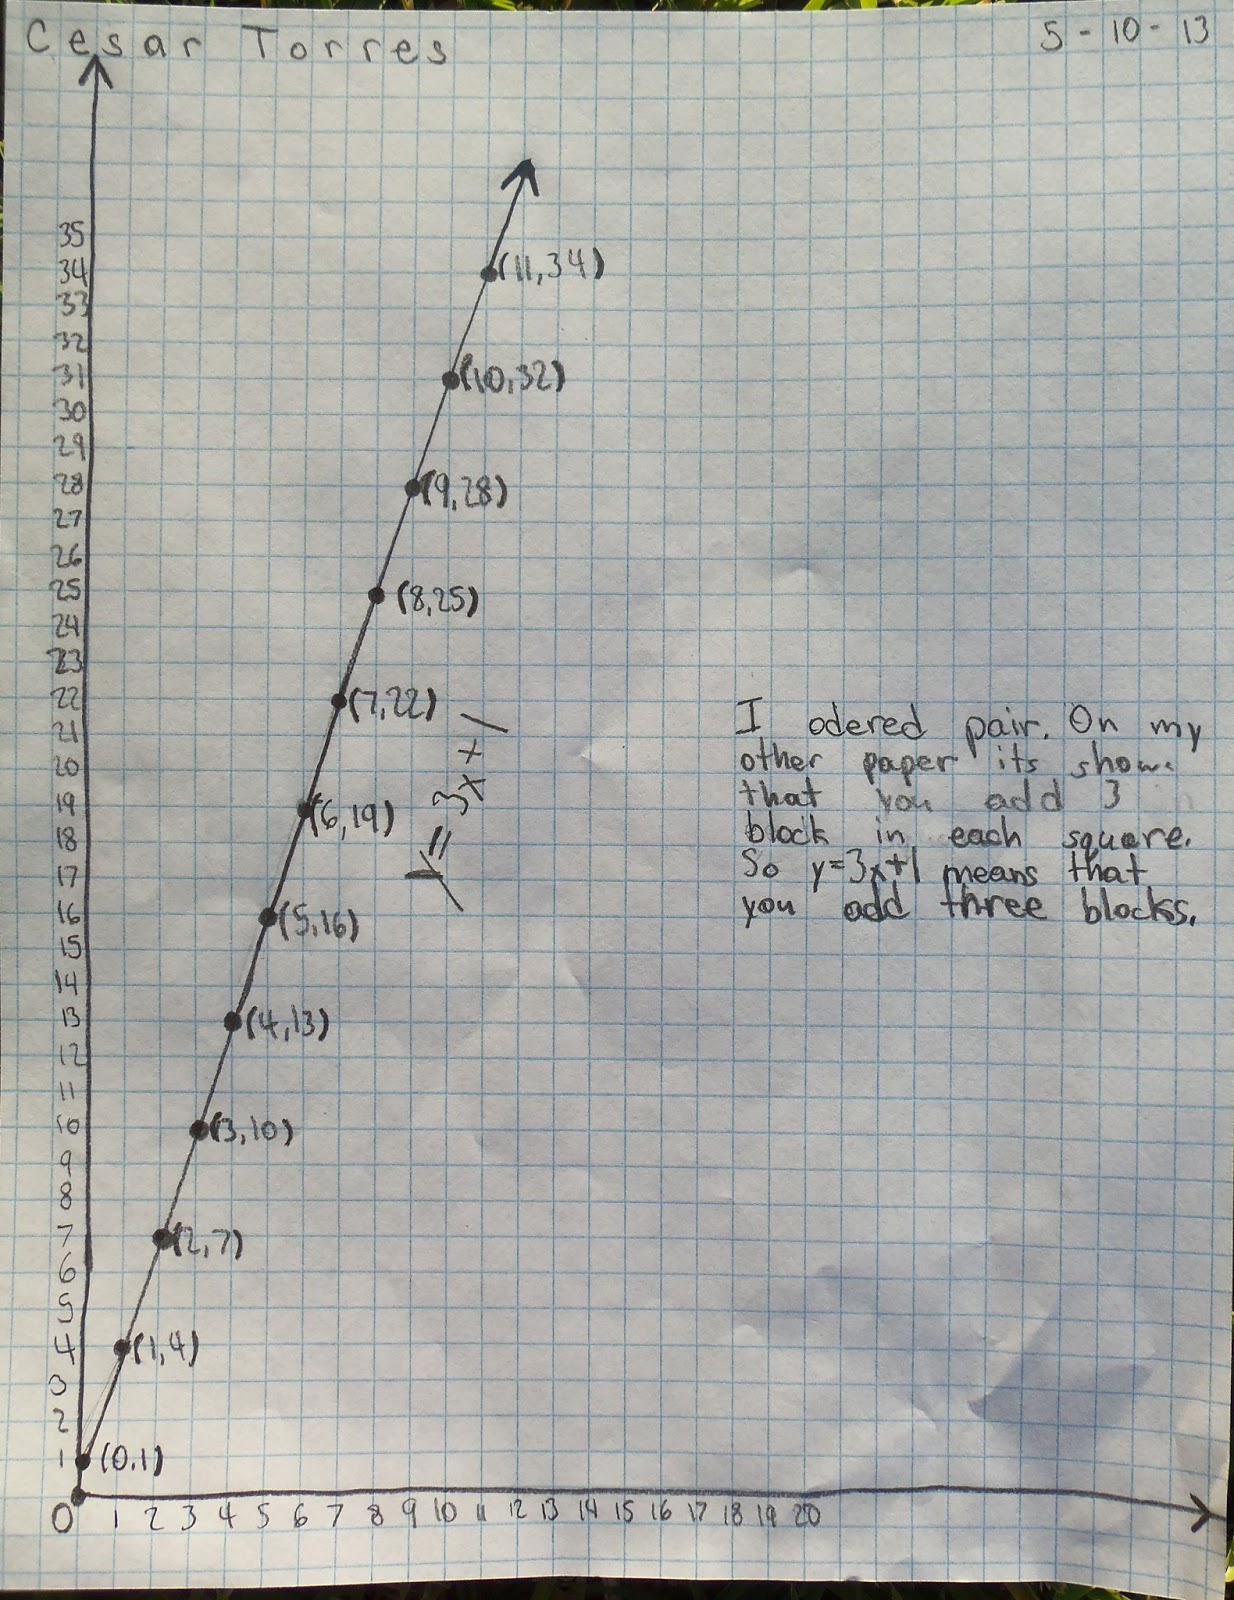
Next, the children recorded this information on their t-charts and shared information with other groups. Finally, they graphed the ordered pairs to see that it did not form a straight line on their graphs. Rather, the graph was curved! They were fascinated with this discovery.

Leslie told me that she figured out the size of the next shape by multiplying. If it was the fourth stage, then she multiplied 4 times 4 to know that she needed 16 blocks.


I used Angie's illustration to show the children why we call these square numbers.
Each time the pattern grows, it forms the next larger square. We reviewed concepts of finding area as we multiplied length times width. (Unfortunately, Angie didn't multiply correctly for stages 6 and 7.)
 Day Two with Growth Patterns

5.NF.B.5 Interpret multiplication as scaling.
This time I told the children to make a small design and make it grow in the same manner as the day before.
Again they saw the square number pattern, so we talked about exponential growth and how fast the number of blocks increased. They LOVED this activity!

So Galilea...if you build the third stage, how many blue blocks will you need?
What is 4 times 9?
And what happens on the fourth stage of your pattern? Don't be lazy! Prove your work. :) That's why the new math standards have MP6 Attend to precision.


Janessa, check the third stage of your pattern. Are the blue blocks still growing in proportion with the orange blocks?
Great job, everyone!


Nice try, men! But look at your third triangle. Is the red in proportion? Remember how I showed you to measure the top AND sides of the red trapezoid? Your sides are only 3 greens long, but the top is 4 greens wide. How can you fix this to make them both the same? Great effort. :)


Connecting Literature with Nonlinear Functions
 After reading Mr. Archimedes' Bath by Pamela Allen, the children wrote an original story called "Piggies in the Mud," a mathematical adventure that models a motion graph.
Henry was a picky pig who loved to play in his mud bath for hours.
Our story is narrated by Erick and the graph is explained by Maria, an English language learner. Well done everyone!


Very proud of you, Maria! Good job understanding the motion graph and explaining it in English!